Cell Well Segmentation
Desktop GUI for immunofluorescence microscopy cell segmentation, cell-level feature extraction, Manders colocalization analysis, QuPath-compatible GeoJSON export, and optional DICE/IoU validation against ground-truth GeoJSON annotations.
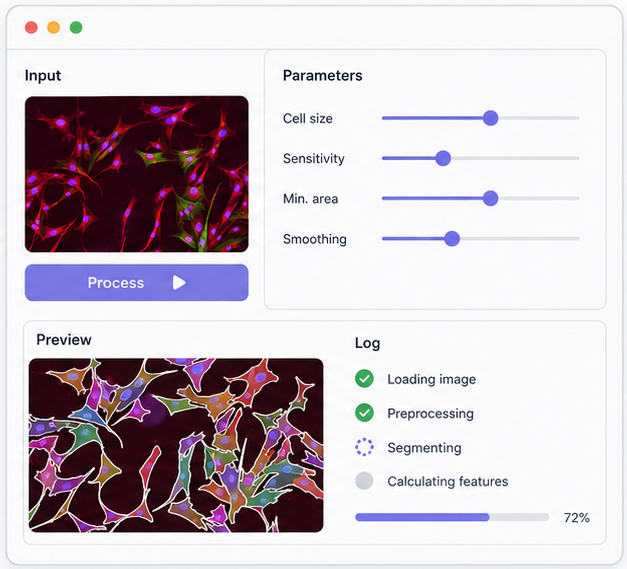
Workflow overview
The application is designed for microscopy workflows where users need to segment individual cells, quantify fluorescence signals, evaluate channel colocalization, and export results for downstream analysis or review in QuPath.
Requirements
- Windows executable release, or Python environment for source execution.
- Microscopy images in TIFF, OME-TIFF, or supported raster formats.
- For validation, a ground-truth GeoJSON annotation in the same coordinate system as the image.
Recommended use
Start with a small ROI in Parameter Exploration, tune the segmentation visually and with DICE/IoU if ground truth is available, then run the full image or batch set.
Main features
- Single-image and bulk-image processing.
- ROI-based parameter exploration before full processing.
- Nuclei-based seed detection and marker-controlled watershed segmentation.
- QuPath-compatible GeoJSON export.
- Skip completed or resume missing outputs for long batch runs.
- Optional DICE/IoU validation using ground-truth GeoJSON.
Channel convention
0: nuclear channel, for example DAPI.1: red marker channel.2: green marker channel.3: cytoplasmic channel used for CellCyto segmentation.
Channel mapping can be changed in the GUI under Custom parameters.
Outputs
For each processed image, the app creates a dedicated output folder with:
RGB.tifandCellCyto.tifcomposite images.instances.tifinstance segmentation mask.cell_features.csvcell-level morphology and intensity features.manders_features.csvManders colocalization metrics.cell_features_with_manders.csvmerged feature table.manders_summary.jsonthreshold summary.qupath_final.geojsonQuPath-compatible annotations.preview.pngquality-control visualization.
Cell-level features
The CSV feature table includes per-cell measurements such as:
- Label ID, area, perimeter and centroid coordinates.
- Red, green and blue mean, max, median, standard deviation and percentile values.
- Total channel intensity per cell.
- Coefficient of variation for red, green and blue channels.
red_positive,green_positiveanddouble_positivebiological positivity flags.
Manders colocalization
Manders coefficients are computed per segmented cell. The red-in-green and green-in-red values are asymmetric and should be interpreted independently: one reports the fraction of red signal overlapping green-positive pixels, while the other reports the fraction of green signal overlapping red-positive pixels.
Biological red/green thresholds are used to classify cells as positive or double-positive and are saved for reproducibility; they do not directly change the segmentation mask.
Validation and parameter tuning
When a ground-truth GeoJSON is available, Cell Well Segmentation can compute pixel-level DICE, IoU, precision and recall. During Parameter Exploration, the full-image GeoJSON can be selected and the application evaluates only the selected ROI, making it easier to tune parameters before processing the full image.
Existing output handling
- Reprocess from zero: recomputes the selected images.
- Skip completed: avoids processing images with complete output folders.
- Resume missing outputs: regenerates missing outputs when intermediate files are available.
Notes and limitations
- Designed for fluorescence cell images where individual cells are distinguishable.
- Parameters may need adjustment for different magnifications, staining patterns or cell densities.
- Not intended as a replacement for manual expert review when validation or publication-quality analysis is required.
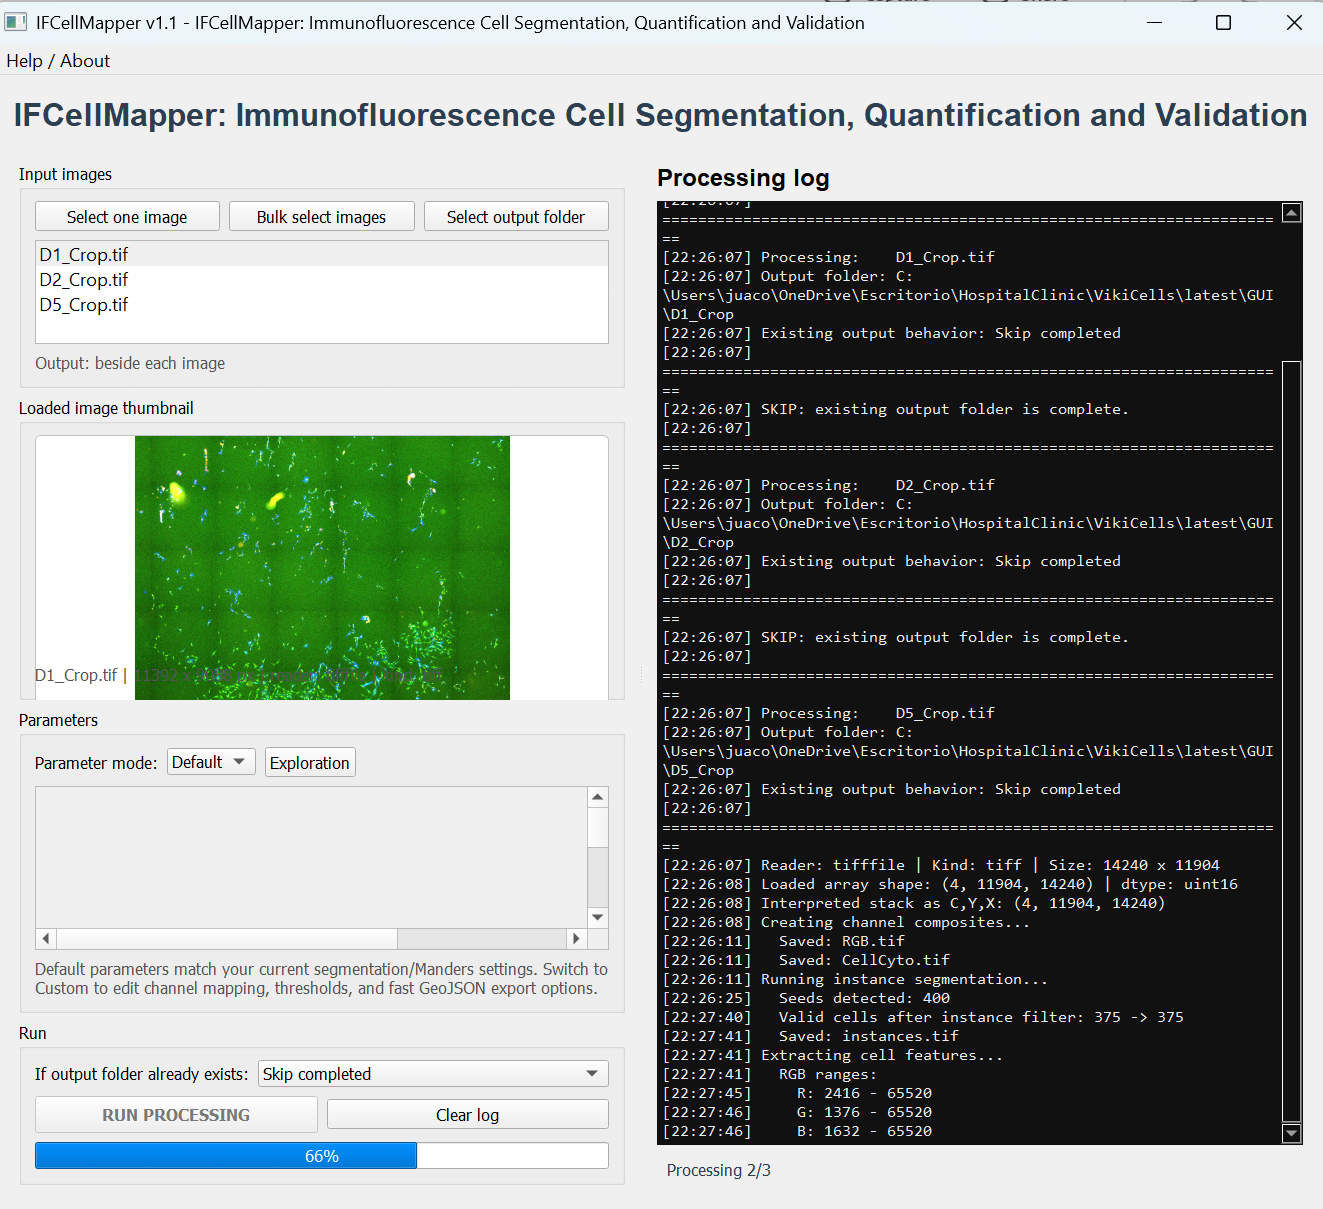
Screenshot
Main interface for selecting images, tuning parameters, running batch processing and reviewing the log.
Citation
Rodriguez Rojas JJ. Cell Well Segmentation: Immunofluorescence Cell Segmentation, Quantification and Validation. Version 1.0.0. Zenodo. 2026. doi: 10.5281/zenodo.20387083.