FeatureStat Studio
Desktop GUI for grouped statistical analysis, publication-ready plots, histograms, ROC biomarker evaluation, and multi-feature batch visualization.
Workflow overview
FeatureStat Studio is designed as a lightweight research tool for exploring grouped experimental, biomedical, or image-derived feature datasets. It brings together data loading, group preparation, pairwise statistics, figure generation, histogram inspection, ROC biomarker analysis, and multi-feature batch outputs in a single desktop interface.

Input data
- Load CSV, TSV, TXT, Excel or pasted clipboard tables.
- Use wide format when each column represents a group.
- Use long format when one column defines groups and several columns define numeric features.
- Prepare groups, rename display labels, and customize colors and marker styles.
- Run validation checks before saving results.
Main features
- Pairwise statistical comparisons between groups.
- Individual-value, bar, box, and violin plots.
- Histogram visualization with automatic or manual binning.
- Univariate ROC analysis for candidate biomarker evaluation.
- Multi-feature batch preview and export workflow.
- Project save/load for reproducible analysis sessions.
Recommended use
- Check that the selected data format matches your table structure.
- Confirm group labels, colors and included groups before analysis.
- Select statistical tests according to the biological and experimental design.
- Use the validation report to review basic data and analysis settings.
- For final reporting, verify representative statistics independently.
Statistical tests
- Unpaired t-test with equal SDs.
- Welch's t-test.
- Mann-Whitney test.
- Kolmogorov-Smirnov test.
- Paired t-test.
- Ratio paired t-test.
- Wilcoxon matched-pairs signed-rank test.
Multiple-comparison correction
- No correction.
- Bonferroni correction.
- Holm correction.
- Benjamini-Hochberg FDR correction.
Corrected p-values and significance symbols can be displayed in result tables and plot annotations.
Plot types
- Individual values with mean ± SD.
- Individual values with mean ± SEM.
- Box plots.
- Violin plots.
- Bar plots with SD or SEM.
ROC biomarker analysis
FeatureStat Studio includes univariate ROC analysis for comparing reference/control groups against positive groups. The tool calculates ROC curves, AUC values, sensitivity, specificity, Youden index, and candidate thresholds on the original feature scale.
Multi-feature workflow
The multi-feature module applies the same group, statistical, ROC, histogram and plotting settings across selected numeric feature columns. Users can preview each feature and then save standardized outputs for the complete selected feature set.
Output layouts
- One 3-panel figure per feature.
- Multiple features per visualization.
- All-feature plots only.
- All-feature histograms only.
Outputs
Depending on the selected analysis, the app can export:
- Cleaned numeric values in CSV format.
- Pairwise statistical results.
- ROC threshold tables and ROC summaries.
- Plot, ROC and histogram figures in image/vector formats.
- Analysis parameters and project snapshots.
- Validation reports and analysis logs.
Standalone builds
- Windows executable generated with PyInstaller.
- Linux executable generated with PyInstaller.
- macOS application bundle generated with PyInstaller.
- GitHub Actions workflow for release builds.
Installation from source
- Clone the repository.
- Create a Python virtual environment.
- Install dependencies with
pip install -r requirements.txt. - Run
python FeatureStat_Studio.py.
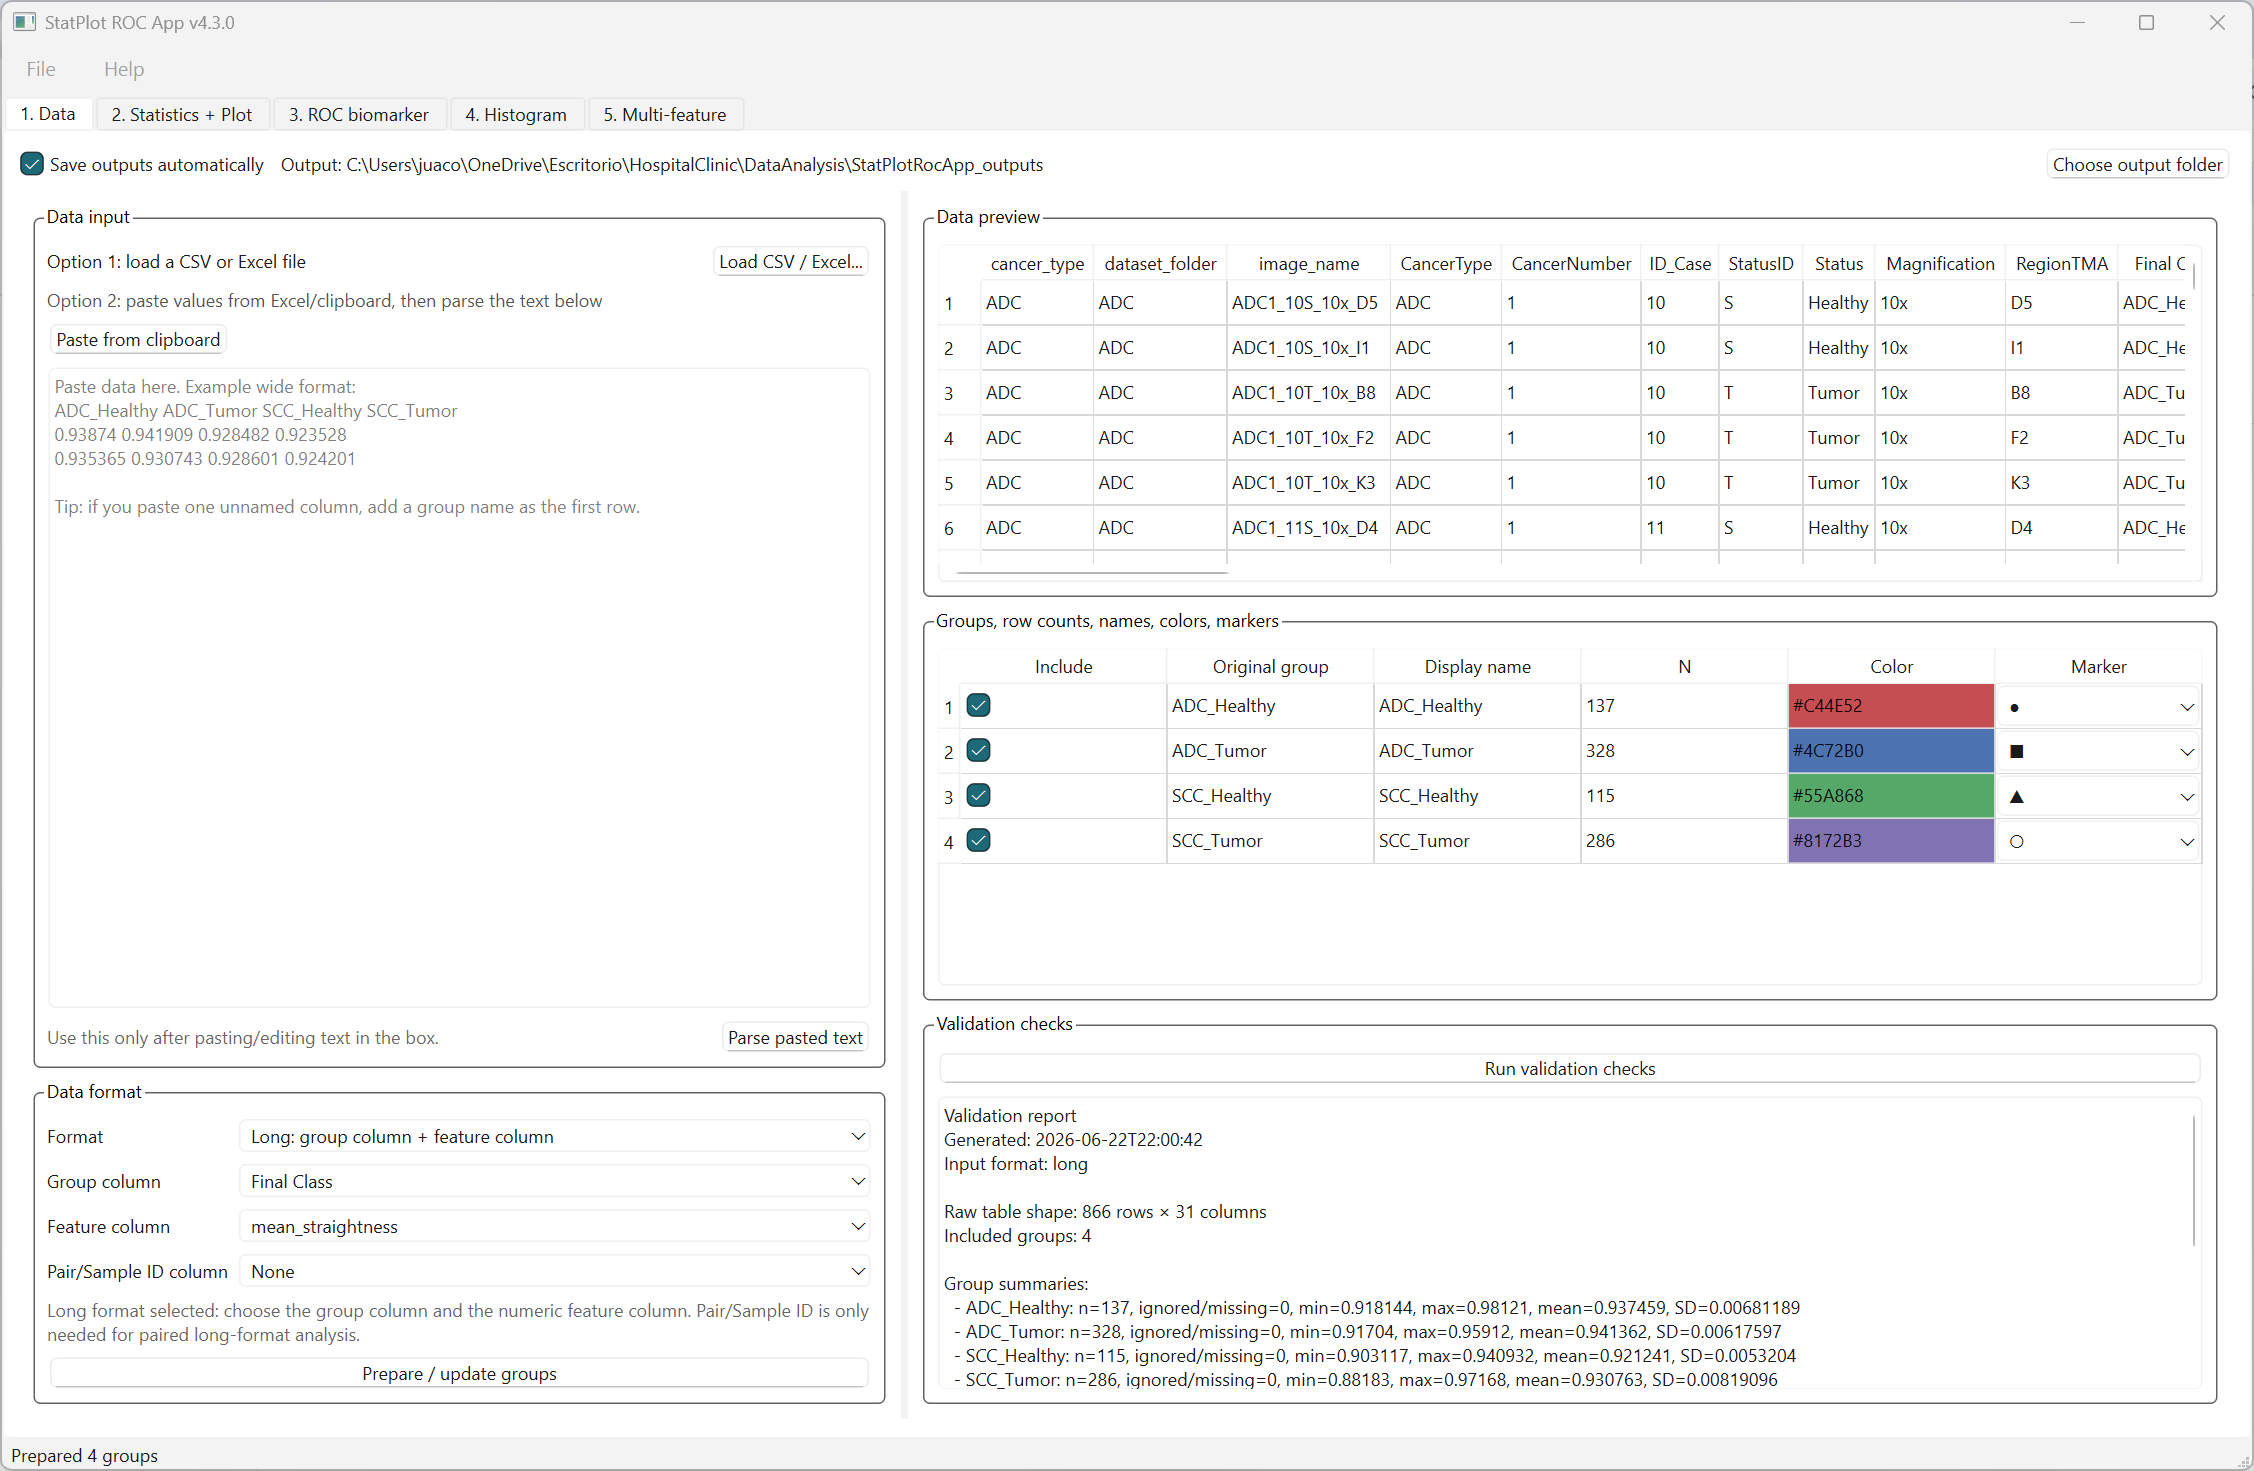
Screenshot
Main interface for loading data, preparing groups, running statistical tests, generating plots, analyzing ROC curves, visualizing histograms and exporting multi-feature results.
Citation
Rodríguez-Rojas J. FeatureStat Studio: A desktop GUI for grouped statistics, feature visualization, ROC biomarker analysis and multi-feature batch outputs. Version 1.0. Zenodo. 2026. doi: 10.5281/zenodo.20803088.